Laravel charts js example tutorial. In this laravel charts js tutorial, you will learn how to implement pie chart using a chart js in laravel applications.
When you work with any web application or e-commerce application etc. So you need to show analytics on these application dashboards.
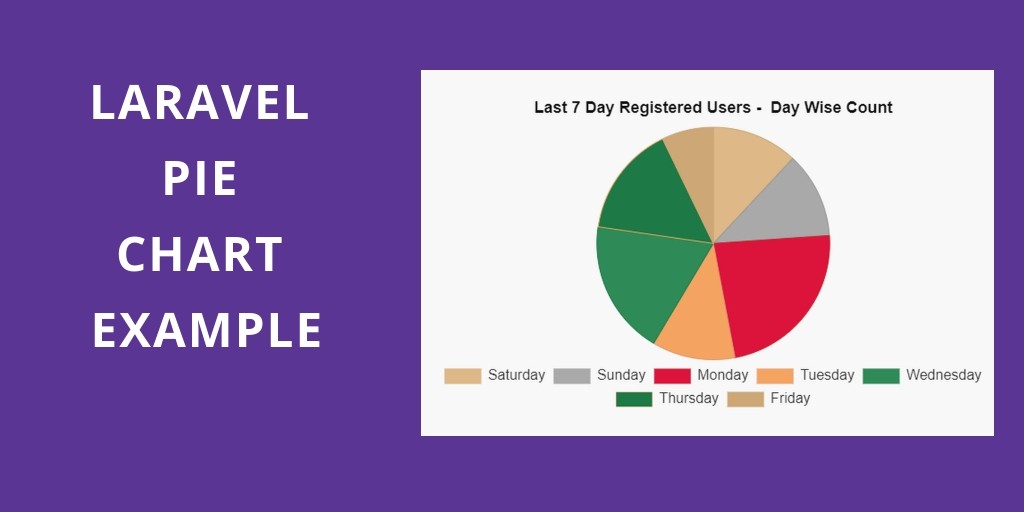
This laravel charts js tutorial helps you step by step on how to fetch the last 7 days data and display it on laravel pie chart in laravel app using charts js.
Laravel Chart Js Example Tutorial
Just follow the below steps and implement Pie Charts in laravel based application using the chart js library.
1. Create a route
In the first step, you need to create routes for the chart js. So go to routes/web.php and update the below route in your file:
Route::get('chart-js', 'ChartController@index');
2. Create Controller
Next step, you need to create a new controller name ChartController.php. And update the below code into your controller:
<?php
namespace App\Http\Controllers;
use App\User;
use Illuminate\Http\Request;
use Redirect,Response;
Use DB;
use Carbon\Carbon;
class ChartController extends Controller
{
/**
* Display a listing of the resource.
*
* @return \Illuminate\Http\Response
*/
public function index()
{
$record = User::select(\DB::raw("COUNT(*) as count"), \DB::raw("DAYNAME(created_at) as day_name"), \DB::raw("DAY(created_at) as day"))
->where('created_at', '>', Carbon::today()->subDay(6))
->groupBy('day_name','day')
->orderBy('day')
->get();
$data = [];
foreach($record as $row) {
$data['label'][] = $row->day_name;
$data['data'][] = (int) $row->count;
}
$data['chart_data'] = json_encode($data);
return view('chart-js', $data);
}
}
3. Create Blade View File
Final steps, in this step you need to create a blade view file. So go to the resources/views/chart-js.blade.php and update the below javascript and HTML code for displaying the pie chart using the chart js libraries:
<!DOCTYPE html>
<html>
<head>
<title>Laravel Chart JS Example Tutorial - Pie Chart - Tutsmake.com</title>
<!-- Latest CSS -->
<link rel="stylesheet" href="https://stackpath.bootstrapcdn.com/bootstrap/4.3.1/css/bootstrap.min.css">
<script src="https://cdnjs.cloudflare.com/ajax/libs/Chart.js/2.8.0/Chart.js"></script>
<script src="https://code.jquery.com/jquery-3.3.1.min.js"></script>
</head>
<body>
<div class="chart-container">
<div class="pie-chart-container">
<canvas id="pie-chart"></canvas>
</div>
</div>
<!-- javascript -->
<script>
$(function(){
//get the pie chart canvas
var cData = JSON.parse(`<?php echo $chart_data; ?>`);
var ctx = $("#pie-chart");
//pie chart data
var data = {
labels: cData.label,
datasets: [
{
label: "Users Count",
data: cData.data,
backgroundColor: [
"#DEB887",
"#A9A9A9",
"#DC143C",
"#F4A460",
"#2E8B57",
"#1D7A46",
"#CDA776",
],
borderColor: [
"#CDA776",
"#989898",
"#CB252B",
"#E39371",
"#1D7A46",
"#F4A460",
"#CDA776",
],
borderWidth: [1, 1, 1, 1, 1,1,1]
}
]
};
//options
var options = {
responsive: true,
title: {
display: true,
position: "top",
text: "Last Week Registered Users - Day Wise Count",
fontSize: 18,
fontColor: "#111"
},
legend: {
display: true,
position: "bottom",
labels: {
fontColor: "#333",
fontSize: 16
}
}
};
//create Pie Chart class object
var chart1 = new Chart(ctx, {
type: "pie",
data: data,
options: options
});
});
</script>
</body>
</html>
Note: Don’t forget to include the chart js libraries, jquery, and bootstrap CDN libraries on your blade view file and you can add or remove this library according to your requirement.
<link rel="stylesheet" href="https://stackpath.bootstrapcdn.com/bootstrap/4.3.1/css/bootstrap.min.css">
<script src="https://cdnjs.cloudflare.com/ajax/libs/Chart.js/2.8.0/Chart.js"></script>
<script src="https://code.jquery.com/jquery-3.3.1.min.js"></script>
Or also don’t forget to add this javascript code. The chart js library also provides so many options for the chart js. You can change or modify according to your requirements.
<script>
$(function(){
//get the pie chart canvas
var cData = JSON.parse(`<?php echo $chart_data; ?>`);
var ctx = $("#pie-chart");
//pie chart data
var data = {
labels: cData.label,
datasets: [
{
label: "Users Count",
data: cData.data,
backgroundColor: [
"#DEB887",
"#A9A9A9",
"#DC143C",
"#F4A460",
"#2E8B57",
"#1D7A46",
"#CDA776",
],
borderColor: [
"#CDA776",
"#989898",
"#CB252B",
"#E39371",
"#1D7A46",
"#F4A460",
"#CDA776",
],
borderWidth: [1, 1, 1, 1, 1,1,1]
}
]
};
//options
var options = {
responsive: true,
title: {
display: true,
position: "top",
text: "Last Week Registered Users - Day Wise Count",
fontSize: 18,
fontColor: "#111"
},
legend: {
display: true,
position: "bottom",
labels: {
fontColor: "#333",
fontSize: 16
}
}
};
//create Pie Chart class object
var chart1 = new Chart(ctx, {
type: "pie",
data: data,
options: options
});
});
</script>