MySQLStreamer is an important application in Yelp’s Data Pipeline infrastructure. It’s responsible for streaming high-volume, business-critical data from our MySQL clusters into our Kafka-powered Data Pipeline.
When we rolled out the first test version of MySQLStreamer, the system operated at under 100 messages/sec. But for it to keep up with our production traffic, the system needed to process upwards of thousands of messages/sec (MySQL databases at Yelp on an average receive over hundreds of millions of data manipulation requests per day, and tens of thousands of queries per second). In order to make that happen, we used a variety of techniques, including smart deployments, running processes on PyPy, and optimizing logs. While some of these delivered a huge bang for our buck, others didn’t. This post will outline a step-by-step approach to optimizing performance of a Real-Time Python Application, outlining the key lessons we learned in the process of getting the MySQLStreamer to process tens of thousands of messages per second.
Step 1: Identify your key performance metrics
Before optimizing our system, we needed to understand what we are optimizing for. Two key metrics to track the performance of any Real-Time System are throughput and latency. For the MySQLStreamer, we defined throughput and latency as follows:
- Throughput: number of messages processed each second.
- Latency: processing time minus event time, where (borrowing definitions from the Apache Flink documentation), “processing time” refers to the system time of the machine that is executing the respective operation, and “event time” refers to the time that each individual event occurred on its producing device. In this case, event time is when the MySQL Database commits a data event, and processing time is when MySQL Streamer actually processes that change.
Our goal was to optimize for increasing the throughput and reducing the application latency. During ideal operations, MySQLStreamer is expected to operate at close to zero latency in real time.
Step 2: Have a way to accurately track these metrics over time
To accurately track these metrics, we use SignalFX. SignalFX is a cloud platform for storing and visualizing time series data and it includes features for building alerts on detectors that help identify system anomalies. Most systems at Yelp use SignalFX as a canonical way of application monitoring and alerting.
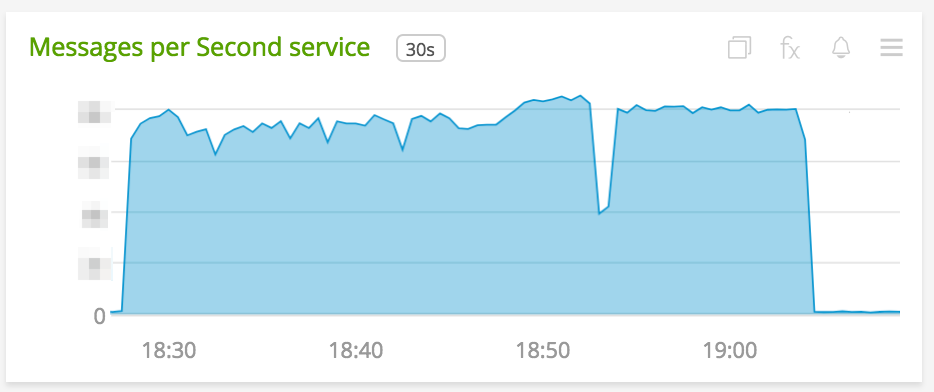
Once you configure your system to emit your key performance metrics, you can get easy-to-follow graphs like these:
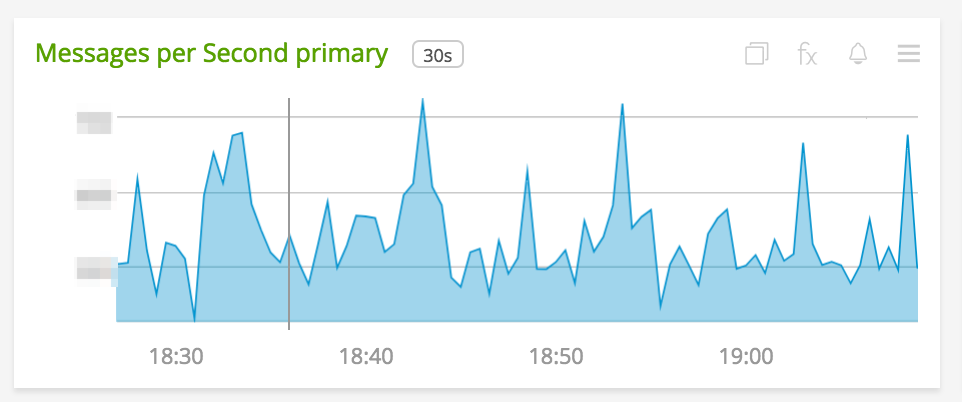
Throughput measured as a time-series
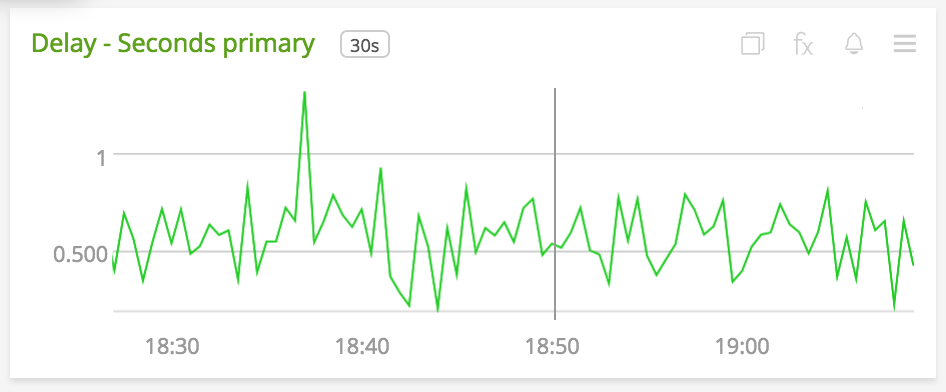
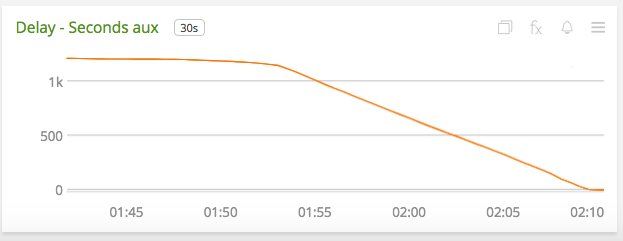
Latency measured as a time-series
Step 3: Have a system that can detect potential performance bottlenecks
Now that we have a way to visualize our key metrics we can work towards optimizing the code for performance. However, how does one know which part of the codebase to improve? Scanning the entire repository for inefficient patterns could work but quickly becomes overwhelming for large code bases. A much more efficient approach would be to use some kind of code profiler that can highlight inefficient functions. In the context of this post I would define inefficient functions as ones that take longer to run in proportion to other functions in your code’s stack trace.
We leveraged vmprof for this purpose. VmProf is a statistical code profiler for Python. In principle, it samples Python stack traces for a certain time duration and then aggregates the results from those samples to generate a flame graph visualization for the stack trace in terms of percentage time each function takes relative to other function.
import vmprof

def _enable_profiler(self):
    self._profiler_fd = os.open(
        PROFILER_FILE_NAME,
        os.O_RDWR | os.O_CREAT | os.O_TRUNC
    )
    vmprof.enable(self._profiler_fd)

def _disable_profiler(self):
    vmprof.disable()
    os.close(self._profiler_fd)
For example:
Step 4: Ensure that you are running your profiler “correctly”
There are two important points about code profiling:
- Choose to generate an online code profile on your production application as often as possible.
- Make sure the application is completely “saturated” before running the profiler.
Generating an online code profile on your production application
Generating an online code profile on your production application is important because your system’s performance patterns may vary significantly between your staging environment and your production environment. For example, you may have a memory leak on production which may not manifest in your staging environment. However, running profiles on production seems like a bad idea since profiling is costly and can slow down the very application that you’re trying to make faster.
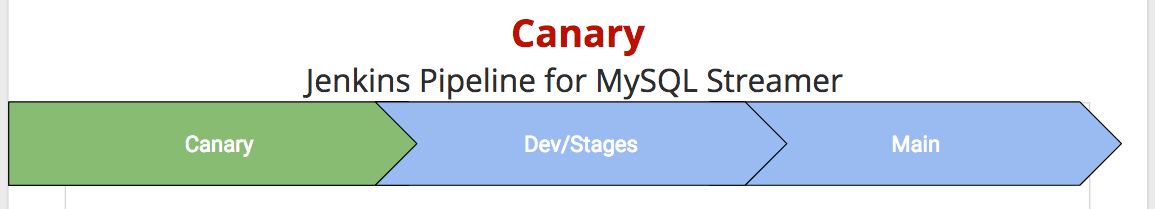
To solve this problem, in the context of MySQLStreamer, we used a special instance of our production application, called “Canary” (borrowing from the “Canary in a coal mine” analogy).
Builds for MySQLStreamer application are run and deployed using Jenkins. We configured our deployment pipeline to comprise of three stages in the following order:
- Canary: These are MySQLStreamer instances running in a production environment. Canary subscribes to data from production MySQL tables and publishes data to production Kafka topics.
- Dev/stage: These are MySQLStreamer instances running in developer & staging environments. These instances subscribe to data from our dev/stage MySQL tables and publish data to our dev/stage Kafka topics.
- Main: These are MySQLStreamer instances running in production. These instances subscribe to data from production MySQL tables and publish data to production Kafka topics (which are used by downstream consumers).
The main distinction between Canary and Main is that:
- New versions of MySQLStreamer are automatically deployed to Canary without human intervention. This facilitates faster iteration on code changes. Developers can now make fearless changes to the code, have it tested against production data without potentially disrupting production usage.
- Deployment to Main, which is the real production application, requires human intervention on jenkins.
- Canary instance of MySQLStreamer is subscribed to the same set of MySQL tables as Main instance but is writing to a different set of kafka topic so that it does not affect production usage of our Data Pipeline.
In addition to providing code profiles on production, the Canary instance also lets you experiment and iterate quickly on code changes to improve performance.
Make sure the application is completely “saturated” before running the profiler
Let me explain this concept with two hypothetical scenarios:
- Your system is processing messages at a rate equal to or higher than the rate of incoming messages. This is an “unsaturated” state - the system hasn’t been tested at its peak performance
- Your system is processing messages at a rate slower than the rate of incoming messages. This is a “saturated” state - under the current implementation, the system cannot go any faster.
Code profiles taken during (A) are less interesting because all you see in the flame graphs are some functions calls that are blocked on IO. In the case of the MySQLStreamer, these manifest as binary log reads from MySQL. On the other hand code profiles taken during (B) are a significantly more accurate depiction of time spent in various function calls during the application’s lifecycle.
We need the system to be in a saturated state (Scenario B) to get valuable profiles, but the system may not be in this state all the time. As a result, we need to “force” our application to get to this state. The way we did this in the MySQLStreamer was by:
- Shutting down the canary instance for 30 mins and then turning it back on.
- Once the application is up and running, we immediately start the profiler and let it run for the amount of time the application is completely saturated.
- We stop profiling just before the application is about to catch up to real time.
The picture below captures the saturated state of the application. Notice how the Latency is decreasing while the Throughput is mostly staying constant.
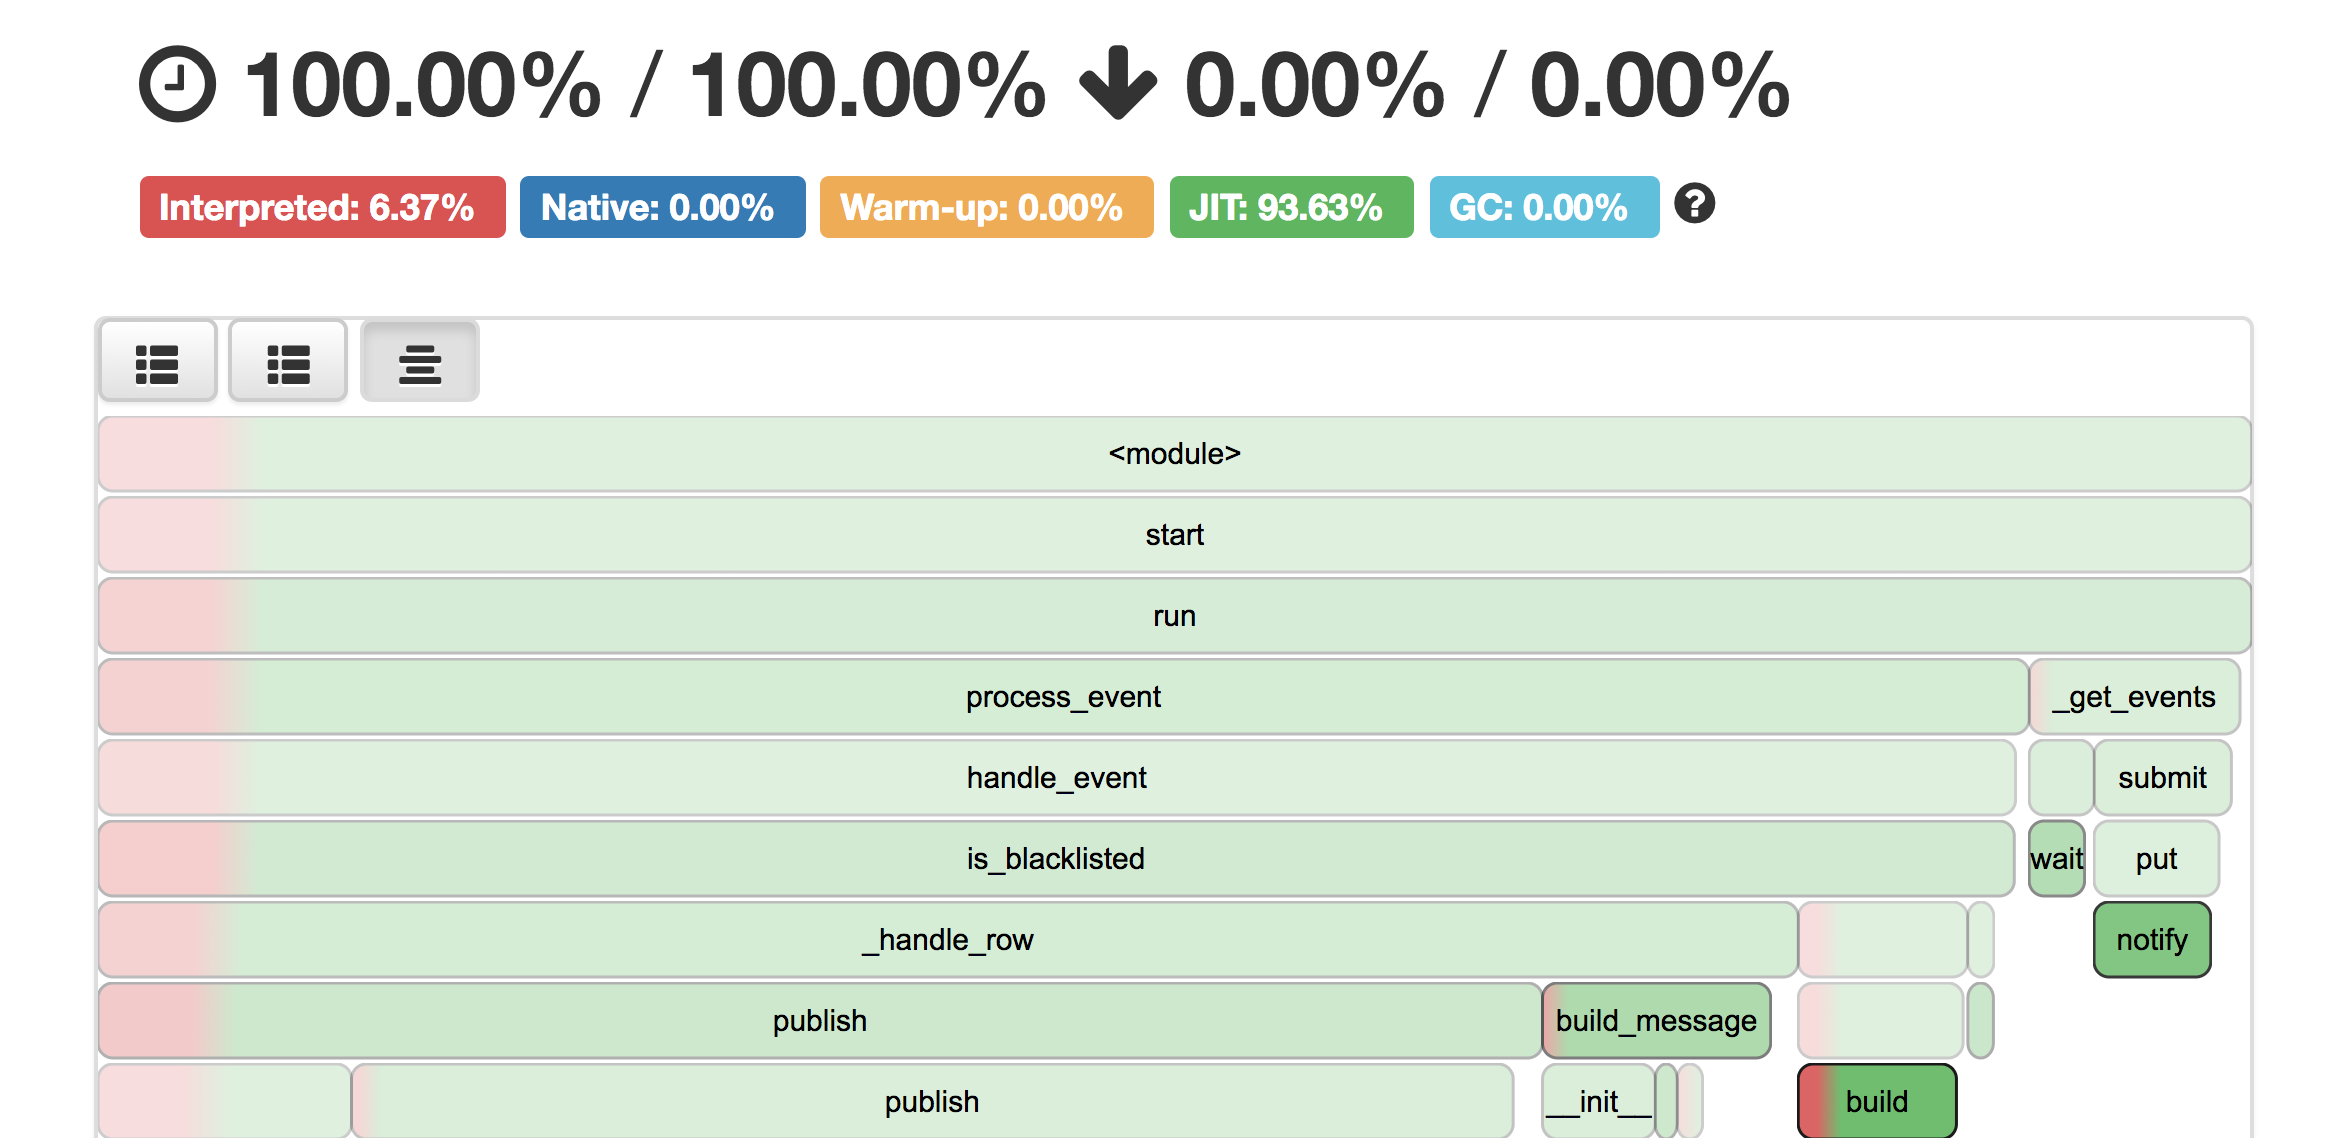
Step 5: Use the results of your profiler to isolate performance bottlenecks
Let’s revisit the MySQLStreamer flame graph from earlier. As you can see above, the application is spending most of its time in publish() and _get_events() functions. These correspond to reading from MySQL binary log and publishing to Kafka respectively. This is not surprising given that these operations are IO bound.
MySQLStreamer also spends a significant amount of time serializing data into AVRO format. Cost of this serialization operation is paid by the build_message() function. Because the logic for AVRO serialization is completely inside python there is definitely some scope for future improvement here.
Step 6: Rinse and repeat
Once you have good profiles and are able to isolate performance bottlenecks, the next step is to make changes and observe your key performance metrics. After trying a number of different approaches to improve the code performance of MySQLStreamer, we learned the following lessons:
Logging can be Expensive
- Remove unnecessary and redundant logs. Don’t have it if you don’t need it. After all, the fastest way to do something is to not do it at all.
- More often than not, DEBUG level logs do not actually materialize into persistent logs. Hence the cost of object serialization or string manipulation involved at the
logger.debugcall site can amount to significant chunk of runtime which is completely unwarranted.
This can be explained by the following code example
import logging
import timeit
import time

logging.basicConfig(filename='example.log',level=logging.INFO)

logger = logging.getLogger(__name__)

class SerializableClass:
    def __str__(self):
        # proxy for indicating complex object serialization
        time.sleep(0.0001)
        return "Some Log"

obj1 = SerializableClass()

def f1():
    logger.debug(str(obj1))

def debug_log(line_lambda):
    """This avoids unnecessary formatting of debug log string.
    """
    if logger.isEnabledFor(logging.DEBUG):
        logger.debug(line_lambda())

def f2():
    debug_log(lambda: str(obj1))

print timeit.timeit(stmt=f1, number=1000) * 1000
print timeit.timeit(stmt=f2, number=1000) * 1000

Result
147.380113602 ms
1.13797187805 ms
In the above example, the global log level is set to INFO which means anything below INFO logging precedence does not make it into the log file. Hence the price paid for object serialization is unnecessary and can be avoided altogether. This small little trick provided a huge win in our application performance.
Focus on the code that runs often
I will try to explain this point using an example. The high level algorithm for MySQLStreamer would look something like:
def process_event(self, event):
    # avro serialize the event
    avro_schema = self.get_avro_schema(event.table)
    self.dp_producer.publish(avro_schema, event.data)

def run(self):
    while True:
        # read from MySQL binary log
        event = self.get_event()
        if event is DataEvent:
            # handle DataEvent
            self.process_event(event)
        else:
            # handle SchemaEvent
Notice that process_event() gets called exactly every data event in MySQL binary log, so any code optimization inside process_event() will result in significant boost in the application performance.
Batch IO operations
In principle, MySQLStreamer subscribes to Data Events from MySQL and publishes them to Kafka. We observed that by increasing the batch size of requests to Kafka from 500 to 3,000 we were able to extract a large amount of performance from the system.
One thing to note here is that we cannot simply keep pushing the batch size up with the hope to get linear growth in performance. If we do that, the application starts to defy the principles of a real-time system. As a result, it’s important to strike a balance between performance and real-time-ness.
Run your application on PyPy
PyPy performs extremely fast due to its Just In Time compilation and uses far less memory than CPython. We have seen 2X-3X improvement in application performance after upgrading from CPython to PyPy. In total, our team successfully runs 3 PyPy applications in production and has been running them for more than a year and a half without any issues.
“If you want your code to run faster, you should probably just use PyPy.”
— Guido van Rossum (creator of Python)
Conclusion
To conclude, here are the steps to keep in mind while trying to performance-optimize your real-time application:
- Identify your key performance metrics - typically, they are “Throughput” and “Latency.”
- Enable your application to emit these key metrics to some kind of time-series charting software like SignalFX.
- Equip your application with some kind of code profiler like VmProf.
- Make sure you have a production-like canary environment in a “saturated” state where you can profile your application’s performance.
- Understand where your application should be spending the most amount of time.
- Generate and inspect the VmProf flamegraph to check if it matches with your understanding. If yes, then quit. If not, document the problem and attempt to fix it.
- Validate by looking at SignalFX graphs.
- Goto (5)