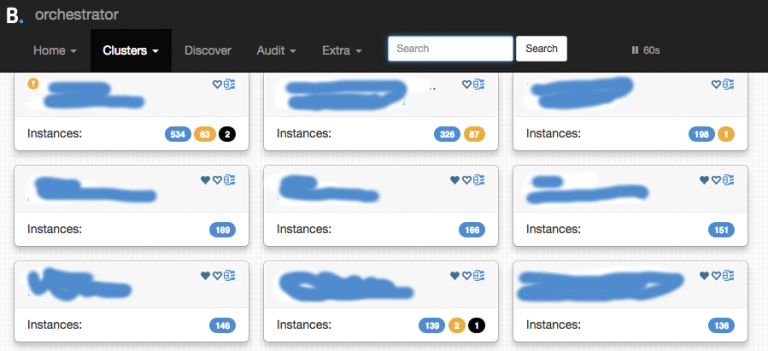
Based on How large can MySQL be in production (article by JF), I have been looking at the awesome Orchestrator visualization of some replication hierarchies.
Names have been removed, but the blue badges indicate some host counts. All of these are installations replicating across multiple Cluster/Data Center Boundaries.
Orchestrator is by far the best tool to discover and manage replication setups like these. You can restructure replication topologies with drag and drop.
If you look inside such a hierarchy, it can be pretty daunting:
What you see is a master server running MySQL 5.7 on the left, in orange. It does replicate to local replicas using instance-fdd8 below, using statement based replication. The local replica then explodes things to a larger number of replicas, also in orange (same DC). Replication lag is slow.
A cross DC-link is indicated above, dotted line. The target DC is rendered in green. Slaves with version numbers and replication lag are being shown. Instance-5a25 is lagging.
The view can be compressed:
Here again, blue badges show counts of servers that have been compressed into one bezel. Note the third cross DC link from green to blue.
Here is a look at the really large hierarchy from the top image. It’s folded and still does not fit:
See the mix of versions: I can spot MySQL 5.6, MySQL 5.7 and one 8.0 (half visible in dark red at the bottom) in the mix.
Topology is really wild, see this part of the diagram:
Again, compressed view – note the server counts in the blue badges. Also see the multitude of cross-cluster connections from the red master to the crowd of orange intermediates. Instance-2835 and children are badly lagging. The rest is fine.


