Laravel Highchart example tutorial. In this tutorial, we will learn how to implement a highchart in laravel application.
When we work with any web application or e-commerce application or any dating application. So we need to show analytics on these application dashboards.
This tutorial helps you, how to fetch month wise data and how to display month wise data in highcharts for analytics on laravel application.
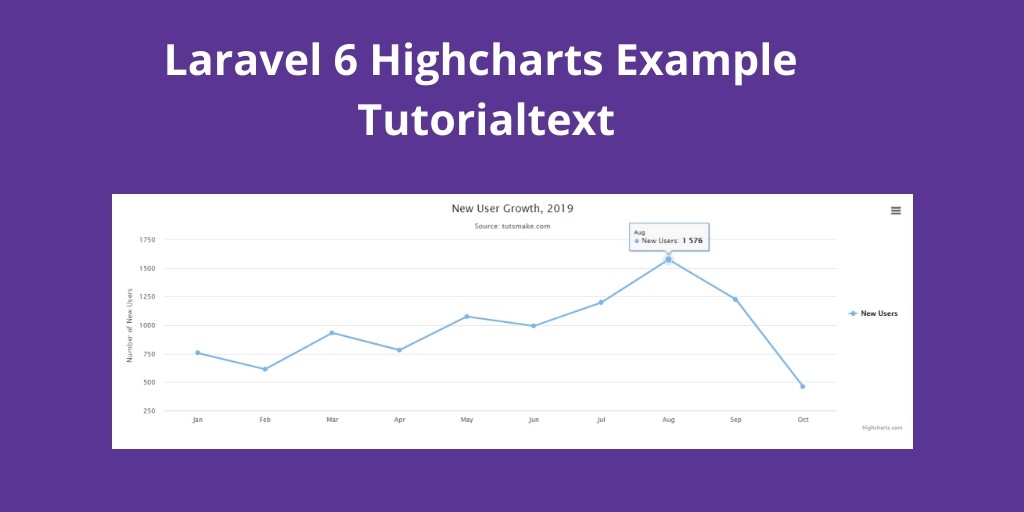
Laravel Highcharts Example Tutorial
Just follow the below steps and easily implement highcharts in laravel application.
1. Create web routes
The first step, we need to create routes for highchart. So go to routes/web.php and update the below route in your file:
Route::get('highchart', 'ChartController@index');
2. Create Controller
Next step, we need to create a new controller name ChartController. And update the below code into your controller:
<?php
namespace App\Http\Controllers;
use App\User;
use Illuminate\Http\Request;
use Redirect,Response;
Use DB;
class ChartController extends Controller
{
/**
* Display a listing of the resource.
*
* @return \Illuminate\Http\Response
*/
public function index()
{
$record['chart'] = User::select(\DB::raw("COUNT(*) as count"))
->whereYear('created_at', date('Y'))
->groupBy(\DB::raw("Month(created_at)"))
->pluck('count');
return view('highchart', $record);
}
}
3. Create Blade File
Final steps, in this step we need to create a blade view file. So go to the resources/views/highchart.blade.php and update the below javascript and HTML code for displaying the highchart:
<!DOCTYPE html>
<html>
<head>
<title>Laravel 7/6 Highcharts Example - Tutsmake.com</title>
<script src="https://code.highcharts.com/highcharts.js"></script>
<script src="https://code.highcharts.com/modules/exporting.js"></script>
<script src="https://code.highcharts.com/modules/export-data.js"></script>
<script src="https://code.highcharts.com/modules/accessibility.js"></script>
</head>
<body>
<div id="container"></div>
</body>
<figure class="highcharts-figure">
<div id="container"></div>
</figure>
<script type="text/javascript">
let chart = JSON.parse(`<?php echo $chart ?>`);
Highcharts.chart('container', {
title: {
text: 'New User Growth, 2019'
},
subtitle: {
text: 'Source: tutsmake.com'
},
xAxis: {
categories: ['Jan', 'Feb', 'Mar', 'Apr', 'May', 'Jun', 'Jul', 'Aug', 'Sep', 'Oct', 'Nov', 'Dec']
},
yAxis: {
title: {
text: 'Number of New Users'
}
},
legend: {
layout: 'vertical',
align: 'right',
verticalAlign: 'middle'
},
plotOptions: {
series: {
allowPointSelect: true
}
},
series: [{
name: 'New Users',
data: chart
}],
responsive: {
rules: [{
condition: {
maxWidth: 500
},
chartOptions: {
legend: {
layout: 'horizontal',
align: 'center',
verticalAlign: 'bottom'
}
}
}]
}
});
</script>
</html>
Note: Don’t forget to include the highchart js libraries on your blade view file and you can add or remove this library according to your requirement.
<script src="https://code.highcharts.com/highcharts.js"></script>
<script src="https://code.highcharts.com/modules/exporting.js"></script>
<script src="https://code.highcharts.com/modules/export-data.js"></script>
<script src="https://code.highcharts.com/modules/accessibility.js"></script>
Or also don’t forget to add this javascript code. The highchart library also provides so many options for the highchart. You can change or modify according to your requirement.
<script type="text/javascript">
let chart = JSON.parse(`<?php echo $chart ?>`);
Highcharts.chart('container', {
title: {
text: 'New User Growth, 2019'
},
subtitle: {
text: 'Source: tutsmake.com'
},
xAxis: {
categories: ['Jan', 'Feb', 'Mar', 'Apr', 'May', 'Jun', 'Jul', 'Aug', 'Sep', 'Oct', 'Nov', 'Dec']
},
yAxis: {
title: {
text: 'Number of New Users'
}
},
legend: {
layout: 'vertical',
align: 'right',
verticalAlign: 'middle'
},
plotOptions: {
series: {
allowPointSelect: true
}
},
series: [{
name: 'New Users',
data: chart
}],
responsive: {
rules: [{
condition: {
maxWidth: 500
},
chartOptions: {
legend: {
layout: 'horizontal',
align: 'center',
verticalAlign: 'bottom'
}
}
}]
}
});
</script>